SavBAT 2 FAQS - Uploading maps and boundaries
|
How do I use the "Confirm Map" display? When you upload a boundary or a clipped vegetation map to SavBAT 2.1, it will appear on a map as shown below. 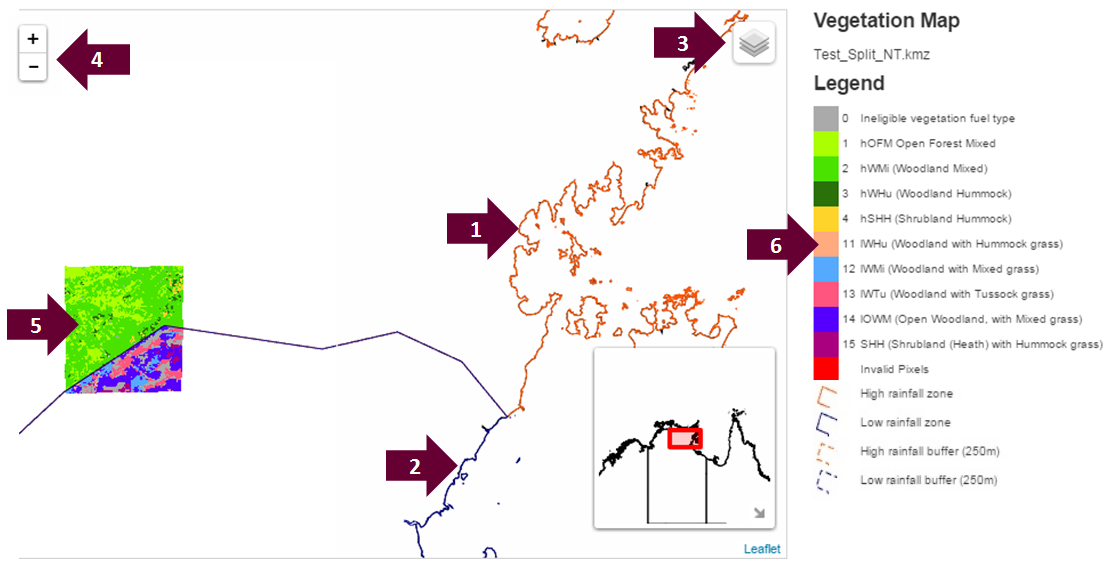 1. The boundary of the high rainfall zone in orange 2. The boundary of the low rainfall zone in blue (on the common boundary of the two zones the colours overlap and may appear purple) 3. A layers tool that allows you to display or hide the boundaries displayed on the SavBAT 2.1 map. One option displays the boundaries extended by a 250m buffer as a dotted line (see legend). This is the actual boundary that SavBAT 2.1 uses to ensure it captures all pixels even partially within the project area, to accurately represent the project area using 250m pixels. 4. Zoom in/out of the map 5. Your uploaded area will be displayed using set colours for the eligible vegetation fuel classes as shown in the legend. These vegetation fuel type maps will either be based on the government-supplied basemap stored by SavBAT 2.1 if you uploaded a simple boundary - or using the vegetation fuel map you uploaded. The sample uploaded map shown above has one section in the High Rainfall Zone and one section in the Low Rainfall Zone. 6. The legend for the different eligible vegetation classes, ineligible pixels and methodology zone boundaries. The High Rainfall Zone vegetation classes are shown in greens and yellows and the Low Rainfall Zone classes are shown in blues and pink/purples. For more information on using the SavBAT map display see pages 14-16 of the
the SavBAT 2.1 User Manual. |