SavBAT 2 FAQS - producing a hypothetical abatement forecast
How do I use the other Results displays?
The Results page for abatement forecasts has two other sections apart from the main grid display:
- On the right hand side there is a table listing the extent in hectares of the vegetation fuel types in your project region, as well as the values of the Global Warming Potentials (GWPs) you entered. This can be useful for relating the forecast emissions to the fuel types in your area, and for confirming you have entered the correct GWP values.
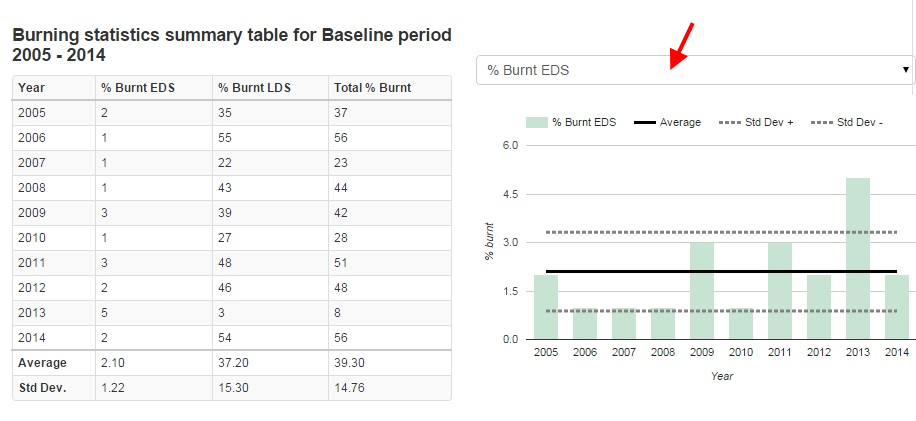
- Below the grid is a table (example below) showing the % of the project region burnt in the EDS, LDS and in total for each year of the chosen baseline. For each category, the average percentage of area burnt and standard deviation are shown at the bottom of the table. To the right of this table is a graph showing the same figures. The default graph shows the % area burnt in the EDS for each year of the baseline along with lines showing the average baseline and the standard deviations above and below it as dotted lines. You can use the drop-down menu (arrowed) to see similar graphs for the LDS and for the total area burnt.
- The average values of % burnt in the EDS and LDS from this table can then be used in the grid display above to forecast the expected average abatement for your baseline - and how much scope there is for improvment on these figures. The standard deviations are useful in showing how much variability you can expect in fire patterns which can be useful in assessing risk.
For more information on the baseline and forecasts see pages 24 and 25 of the the SavBAT 2.1 User Manual.