SavBAT 2 FAQS - producing a hypothetical abatement forecast
How do I use the Results grid display?
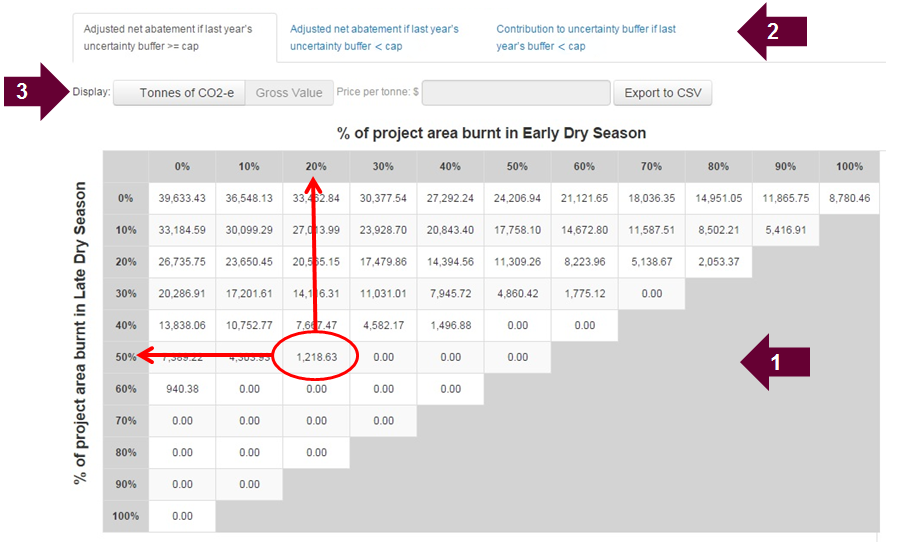
1. The main part of the results display is a grid showing tonnes of greenhouse gas emissions - equivalent to tonnes of CO2 (CO2-e) - associated with different levels of Early Dry Season and Late Dry Season burning. These levels are shown on the left and top sides of the grid - for example, the circled figure of 1,218.63 tonnes corresponds to the case where 50% of the area was burnt in the Late Dry Season and 20% burnt in the Early Dry Season.
2. You have a choice of three types of grid by clicking on the tabs at the top of the page:
- The left tab, which displays by default and is shown above, displays the adjusted net abatement if your uncertainty buffer from last year was greater than your cap (which is set at 5% of your baseline emissions). In this case no adjustment is made to your abatement. Note that for than a certain level of burning (e.g. in the example above 70% or more burnt in the Late Dry Season) no abatement is forecast
- The centre tab shows the grid you will need to refer to if your uncertainty buffer from last year is less than your cap. In this case 10% of your abated emissions will be placed in your buffer for this year - so the adjusted net abatement will be 90% of the levels in the first grid. In the example above, the net abatement for a forecast involving 50% LDS, 20% EDS burnt area will be 90% of 1,218.63 or 1,096.77 tonnes.
- The right tab shows the contributions your abatement makes to the uncertainty buffer when your buffer is less than your cap - which will be 10% of your abatement. In the case above, the buffer contribution for a forecast involving 50% LDS, 20% EDS burnt area will be 10% of 1,218.63 or 121.86 tonnes. Note that if you have a forecast of negative abatement, then the entire amount will be removed from your buffer - which is what the buffer is for. So this grid shows the small 10% figures for forecasts of positive abatement and large figures for forecasts of negative abatement.
3. For the first two tabs you can change the grid to show gross amounts earned by entering expected prices per tonne of CO2-e.
For more information on the grid display and forecasts see pages 22-25 of the the SavBAT 2.1 User Manual.