GIS data
|
The field of mapping and GIS has its own language. Below we will go over some of the key concepts and words you might come across when working with map data, especially in a fire management context.
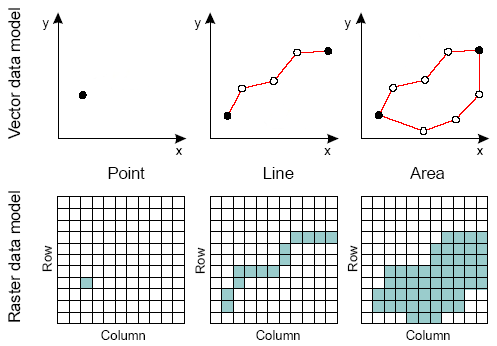
As mentioned briefly before, map data identifies features and positions on the Earth. Within the field of mapping/GIS there are two data types used to represent
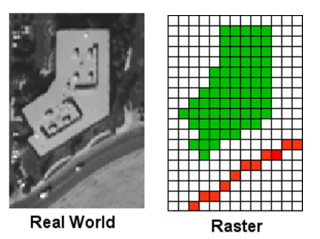
these features; vector and raster data. The main difference between these two data types is that vector data is presented as a point, line or area, whereas raster
data is represented as a grid of pixels as shown above. 1. Vector Data
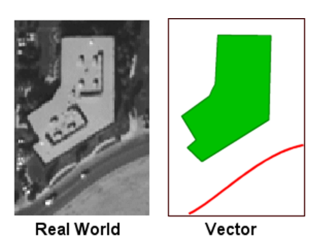
Vector data maps things on the ground as points (distinct locations), lines and areas also known as polygons. Polygons are line boundaries around the perimeter of a feature. Shown above is an example of a picture of features in the real world, and how they might be displayed as 'vector' map data, or lines and polygons. In fire management points might be hotspots (active fire locations), bore points or sacred sites; lines might be incendiary tracks, roads or rivers; Polygons might be burnt areas, paddock boundaries or vegetation.
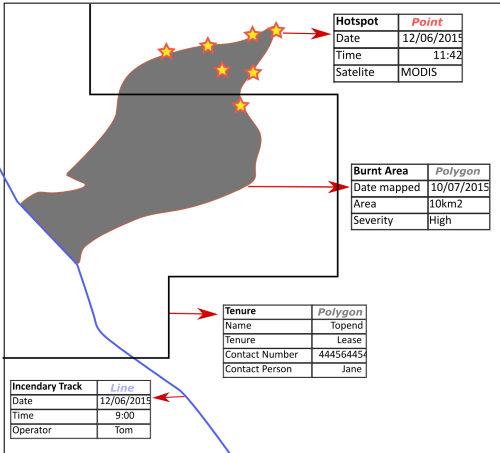
Central to the use of vector data is the fact that each point, line or polygon has a table of information linked to it describing things about it. In the example
above there are:
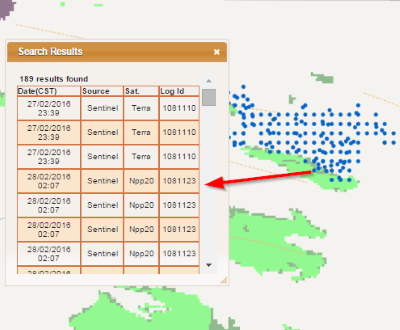
Attribute data can also be accessed via website maps such as NAFI. In the example above from NAFI the hotspots contain attribute information associated with each point (hotspot) about the date and time it was recorded, source (where the data came from) and which satellite recorded the hotspot. Just as there are different types of vector data (points, lines, polygons), so too can vector data be stored in a number of different file formats: 2. Raster Data
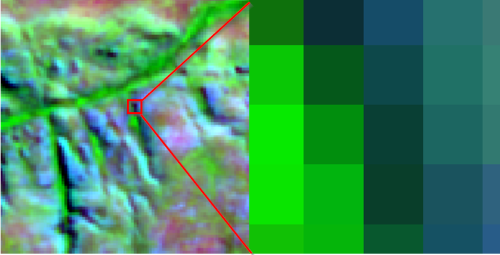
Raster data represents the earth's surface as a grid of cells (also called pixels). Each pixel is the same size, and each one represents a location. Each pixel has a number value that represents some characteristic of that region. The satellite imagery from which fires are mapped is one example of raster data. With satellite imagery, each pixel has a number value representing the amount of reflected sunlight captured by the satellite sensor. The image below shows a region of the Arnhem Land escarpment. When you zoom in we can see the actual pixels making up that image. This is very similar to the way a digital camera or your phone stores photos.
It is common to display vector and raster data together. For example you may have a GPS point you gathered in the field (Vector) and you display them over satellite imagery on Google earth (Raster). Each data type can support our planning work in different ways. 3. Coordinate Systems A coordinate system is a system of recording a location on the earth's surface - every location can be identified by a unique set of numbers. The two most commonly used
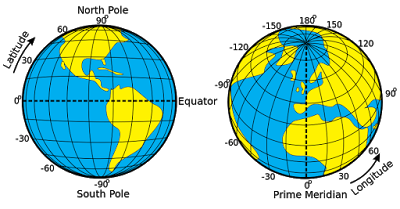
coordinate systems you will come across are the Geographic coordinate system that uses latitude and longitude to mark points on the earth, and the Universal Transverse
Mercator (UTM) system that uses eastings and Northings.
The Geographic coordinate system draws straight lines from the top to the bottom of the earth; these are called lines of latitude. These lines are measured in the number degrees they are from the equator. Lines around the earth are called lines of longitude. These lines are measured in the number of degrees they are from an imaginary line called the prime meridian. The image above shows this system.
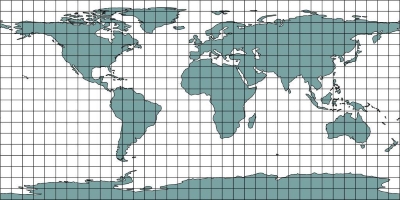
The UTM system divides the world into grid zones (above), and position is indicated by an easting and northing position within one of these grid cells. |