GIS and rangelands fire management
|
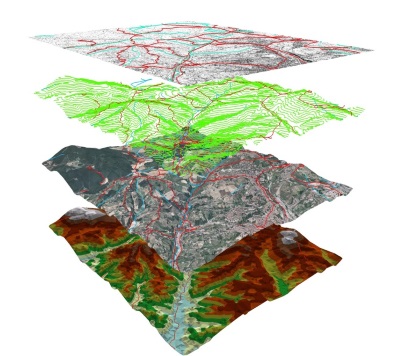
GIS (Geographic Information Systems) is a computer-based tool enabling the viewing, storage and querying of map-based information – ie info about some portion of the earth. A GIS stores information about particular features of the earth as separate map layers. This can be information about features such as vegetation, roads, towns, rivers, or burnt areas. Because these features are ‘mapped’, or related to the earth’s surface, they can be overlaid on top of each other (as in the picture example on the right) to display and answer questions about their relationship to each other. 1. What are the types of GIS used in bushfire management?
2. What are the types of map information used in bushfires management?
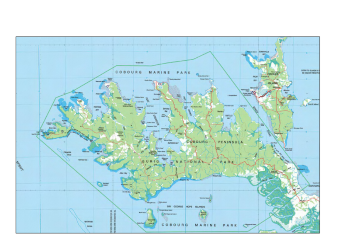
Digital topographic maps: these are maps of the earth’s features provided by the government. They include information about man-made features (eg roads, airports, places), water features (rivers, swamps, streams), and land-based features such as vegetation and hills. For example this topographic map (above) of the Cobourg Peninsula, shows features such as roads (red lines), rivers (blue lines) vegetated areas green), and places (black circles)
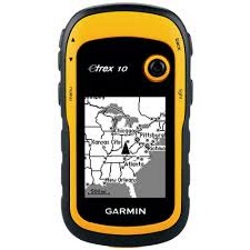
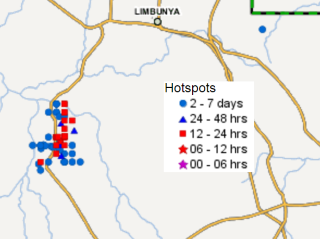
Points from the field: point data refers to specific locations on the ground. The most common type of point information used in bushfire management is ‘hotspots’. These points indicate the location of an active fire, as detected by satellites in the sky. Point/track information can also be recorded in the field on a GPS, and could include the start or end points of a burning run, or tracks recording burning routes.
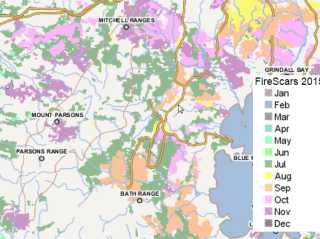
Satellite pictures showing burnt areas: Fires are mapped from satellite pictures to show areas of recently burnt country. On the NAFI website, these areas are displayed in different colours depending on the month in which they occur. The mapabove, from the NAFI website, shows hotspots or active fire locations (blue points), with a topographic line map in the background. The time of each hotspot can be determined from the accompanying legend. |