|
Map data is useful through the fire year, providing information about (a)where fires are burning, (b) what has already burnt, and (c) what burnt last year.
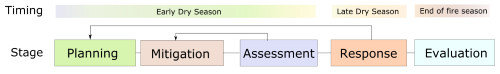
Below is a diagram outlining the fire year and the fire management stages that occur during the year. During each of these activities there are specific
map information tools that are critical for informing your work.
1. Using Map Data throughout the Fire Season
At the beginning of each year it is useful to develop a fire management plan, firstly identifying important areas in need of protection from fire; for example,
key infrastructure, sacred sites or environmentally sensitive areas. This information may be stored on a computer in a Geographic Information System (GIS)
and/or printed in a hard copy map form. It is then useful to look at the landscape to understand where fires might come from and landscape features that might
stop fires, for example big rivers or roads. This information may also be on a map or viewed on an air-photo or satellite image. Google Earth, for example, can
help to identify both valuable areas and natural fire barriers in the landscape. You should also look at where fires occurred in recent years, as this will help
you understand where there might be more or less fuel lying about. The North Australian Fire Information website (NAFI) can provide you with information about this.
This information combined with local knowledge makes it possible to map out where country is vulnerable and where needs to be protected, and to develop a
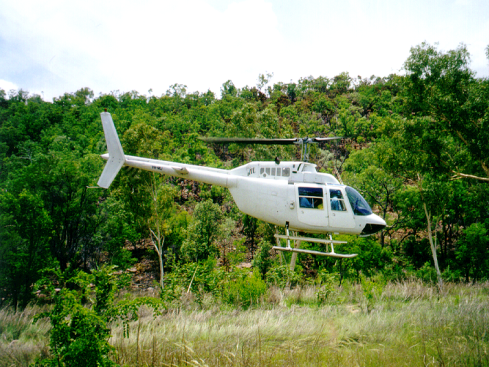
strategic burning plan identifying where fire breaks will be located on the ground. These breaks are then put in place in the next stage of the activities, using
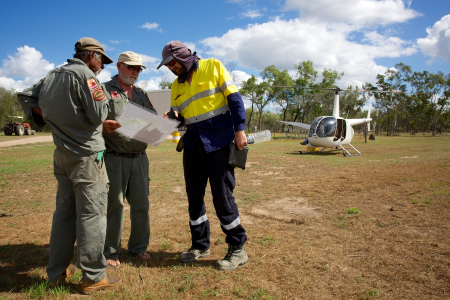
either aerial incendiary drops from a helicopter, or burning from a car or even walking into country for fine scale strategic burning. In order to share your
burning plans with others, it is possible to draw your planned breaks onto a hard-copy map or in a GIS.
2. Mitigation
This is the stage where you put in the fire breaks planned previously. Known as the "mitigation phase", when in the field implementing your planned breaks, it is
important that the planning you conducted on hard copy map or computer is uploaded to a GPS to direct your operations. You can also use computers, tablets (I-Pads)
or smart phones to view maps of your planned burn lines and where you are traveling in the field.
Whilst in the field it can be useful to record the locations of
these breaks, (which can differ to the planned breaks due to conditions on the ground), to assess how successful your burning operations have been. If you are using
an aerial incendiary device such as a RainDanceTM machine, these can be set up to automatically collect a GPS location point every time an incendiary is dropped.
Linking information stored on a computer or GPS can be made easier using management software such as BaseCampTM.
3. Assessment
Throughout the dry season you will need to monitor the outcomes from your burning program to make sure you are getting the results you require. There are a number
of ways to understand what you have burnt and where. The most common tool used in Northern Australia Is the NAFI website, which has regularly updated maps of active
fires and burnt areas.
Active fires are shown via hotspots which are updated every few hours. Burnt area maps show you what has already burnt, and are updated every week or so throughout
the entire year. These data are produced via a number of satellites that pass over Northern Australia multiple times every day.
Some fire managers also use other satellite data to produce clearer pictures of where and when burning has occurred. One such satellite commonly used is Landsat.
4. Response
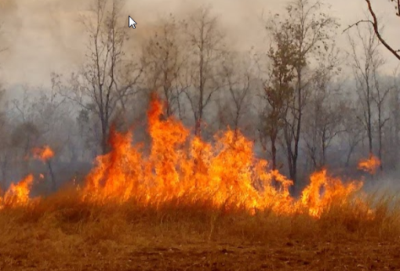
Later in the year when you are more likely to get dangerous, hot wild fires it is important to assess what if any intervention response is possible. To do this it
is important to be monitoring active fires via hotspots provided by web based fire mapping services such as NAFI to determine if and where dangerous fires might be
occurring.
You then need to view these fires with reference to all of your base information developed during your initial planning stage around vulnerable areas, previous burning,
natural breaks and points of access. It can be very helpful at this stage to bring the mapping provided through Web services onto your own computer and/or hard copy map
to assist with this process.
5. Evaluation
At the end of a fire year it is important to assess the outcomes in terms of management successes and evaluate the environmental or economic benefits and impacts.
This is particularly critical if, for example, you are running a carbon farming project, as you will need to be able to show the burning you have conducted and calculate
the carbon benefits before you can get paid.
Key to these assessments is maps of burnt areas throughout the year with information about when fires occurred. Data about where strategic fire management was conducted can
also be useful in determining how successful the management burning strategies have been. Satellite derived mapping or hotspots can also be used to follow the spread of
particular fires over time, which can be useful for understanding ignition and outcomes.
|